January 22, 2024
Thanks Microwaves & RF for writing a great article about two of our partners / suppliers - Megiq and Summit Electronics. Microwaves & RF as a premier media brand that specializes in providing comprehensive information and resources for its audience of specialists in high-frequency electronic design.
Please read the article below and contact the TOP support team for a demo in our own lab or more information about the possibilities.
What you’ll learn:
In a world where wireless devices have become an integral part of daily life, the guarantee of reliable wireless networks is more crucial than ever. Accurately predicting the propagation characteristics of wireless signals is highly desirable.
However, due to the complex nature of wireless signal propagation in volatile environments, simulating such scenarios is notoriously difficult and lacks accuracy.1 As a result, characterizing wireless signal propagation is often neglected and wireless networks are set up based on intuition and simple measurements.
This article employs measurements to describe the impact of environmental factors on wireless signal propagation and strives to offer insights into the requirements for an optimal implementation of wireless networks.
The measurements in this article were conducted to examine the effect of distance and objects on the signal reception of a wireless device. At one specific location in a building, the received signal-strength indicator (RSSI) was determined for six different transmitter locations.
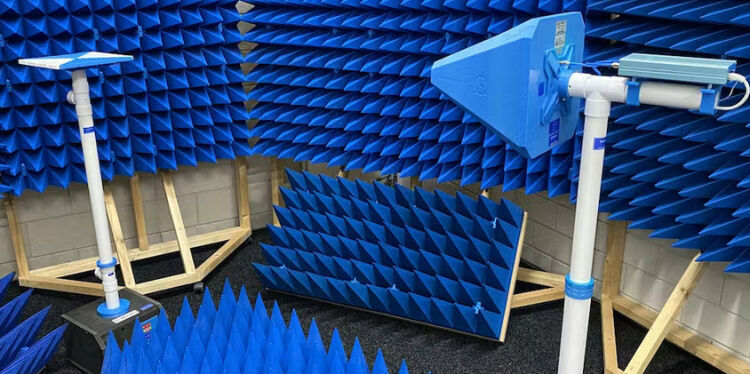
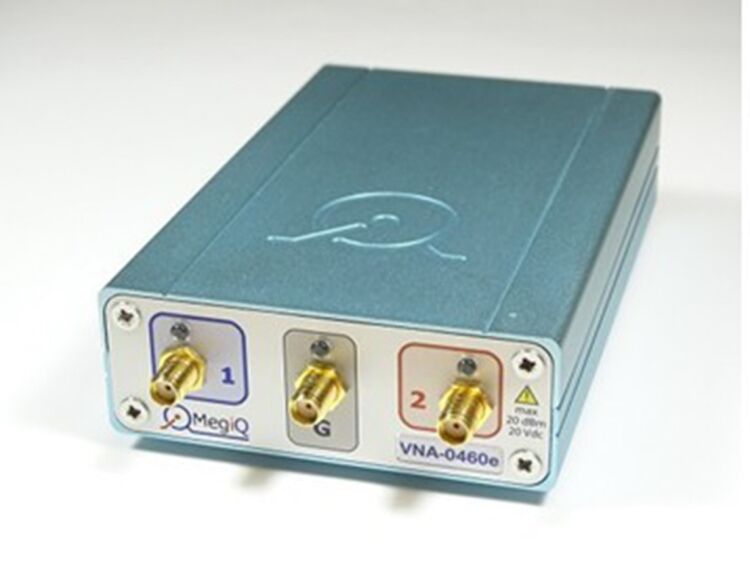
A MegiQ VNA-0460e (Fig. 1) was employed for signal transmission and a MegiQ RMS-0460 Antenna Radiation Measurement System (Fig. 2) for signal reception.2 A comparison between RSSI values provides insights into the behavior of wireless signals in a typical indoor scenario.
.")
.")
The antennas used in the measurement setup are linearly polarized wideband paddle antennas from Summit Electronics, provided by TOP-electronics (Fig. 3).3 A full characterization of the RF impedance of these antennas was conducted using the MegiQ VNA for frequencies between 400 MHz and 6 GHz (Fig. 4).


The wireless signal propagation of these antennas was characterized using the MegiQ RMS. RMS measurements include, but are not limited to, the field strength, antenna gain, effective isotropic radiated power (EIRP), and total radiated power (TRP) for frequencies between 370 MHz and 6 GHz. To obtain 3D electromagnetic radiation patterns of the antennas, a full scan over three antenna rotations was performed in a matter of minutes for the entire frequency range of the MegiQ RMS. The resulting radiation patterns for a horizontally polarized transmitting antenna at a frequency of 2.4 GHz are illustrated in Figure 5.

Figure 6 represents the return loss (RL) and total isotropic gain (TIG) of the antennas, measured by the MegiQ VNA and MegiQ RMS, respectively. A comparison between the RL and TIG illustrates their inversely proportional behavior. A change in RL indicates a change in power reflection and thus in impedance matching. It would therefore be expected that the TIG responds inversely to the RL, i.e., when one increases, the other tends to decrease.
 and total isotropic gain (TIG) of the wideband paddle antenna as illustrated in Figure 3. The comparison between the RL and TIG indicates their inversely proportional behavior.")
To determine the correlation between these two properties, the MegiQ VNA software can translate the RL to the forward loss (FL), representing the amount of power that’s accepted by the antenna. Figure 7 represents both the FL and TIG.
 and total isotropic gain (TIG) of the wideband paddle antenna as shown in Figure 3. FL is defined as the amount of power that’s accepted by the antenna. The comparison between the FL and TIG illustrates their directly proportional behavior.")
In an ideal situation, the FL and TIG should be equal if all accepted power is transmitted by the antenna. The deviation between them therefore reveals the importance of wireless signal propagation measurements. The TIG includes all antenna losses and environmental effects, which aren’t detected with the VNA impedance measurements.
During all RSSI measurements, the paddle antennas were connected to the MegiQ VNA to excite them at an accurately controlled power level. The MegiQ RMS then measured the RSSI using the same paddle antennas, as this represents a realistic scenario in which two similar devices are communicating. The antennas were oriented such that both a horizontal and a vertical linearly polarized electromagnetic field were transmitted and received. Figure 8 shows the measurement setup.
 and the VNA (right).")
To measure the RSSI for different transmitter locations, the turntable of the MegiQ RMS had to be positioned at these locations as well. Due to the versatility of the MegiQ RMS, this was achieved by controlling the turntable wirelessly using a Silex DS-600 Network USB Server. After connecting the turntable to the Silex DS-600, the RMS software was able to control it without the need for a wired connection between the RMS and the turntable.
The affordability, high accuracy, and versatility of the MegiQ VNA and MegiQ RMS rendered them the ideal equipment for the measurements conducted in this article.
Figures 9 and 10 illustrate the measured RSSI for different transmitter locations on a floorplan, with values averaged over the transmitted horizontal and vertical linearly polarized electromagnetic fields. This consideration is significant as many wireless devices are often used in varying orientations, randomizing the direction of polarization.

.")
The receiver antenna is positioned on the ground floor and indicated with a cross. The locations of transmitter antennas are indicated with black dots. The bar charts visualize the measured RSSI for the different transmitter locations, where the grey part represents the noise, the light-colored part represents the minimum RSSI, and the dark colored part the average RSSI.
Figures 9 and 10 represent a selection of six frequencies:
As expected, the bar charts indicate that the RSSI decreases as the distance between the transmitter and receiver increases. Furthermore, they show that this rate of decrease is larger for higher frequencies, which can be explained by the Friis transmission equation for free space, defined by:4

where:
For higher frequencies (f), an increase in distance between the transmitter and receiver (R) results in a lower received power (Pr) than for lower frequencies.
In addition, this effect is amplified by the objects in the environment. Due to the smaller wavelength of signals with a higher frequency, these signals tend to observe more details in objects. As a result, they’re more likely to interact with, for example, the metal grid in reinforced concrete, metal components in furniture, and even the coatings in insulated windows.
Despite their advantages, higher-frequency signals clearly also have their disadvantages. To mitigate these and ensure reliable wireless networks, it’s crucial to consider wireless signal propagation not only during the design of wireless products, but during the construction of buildings and setup of wireless networks as well.
Moving the antennas to different locations tends to change the measured radiation pattern. As Figure 11 indicates with RSSI measurements at a frequency of 915 MHz, the orientation, shape, and distribution of electromagnetic polarization differ across the radiation patterns obtained from various transmitter locations. These changes can be attributed to various phenomena, like multipath propagation, fading, and polarization alteration.5 Some of the most significant phenomena are mentioned below.

Whenever a signal interacts with objects, it can be absorbed, reflected, transmitted, scattered, and diffracted.5 All of these different interactions can cause changes in the signal, like its intensity, frequency, phase, polarization, and direction. Furthermore, it leads to different paths in which the signal travels to the receiver, called multipath propagation. The detected RSSI at the receiver is highly affected by all of these interactions due to the different properties of the multipath components and the receiver’s sensitivity to certain properties of the signal.
Interactions between the individual multipath components impact the RSSI, too. This is caused by constructive and destructive interference, where the combination of signals leads to an amplification or attenuation of the signal.
Depending on the composition and electrical properties of objects, interactions with objects potentially alter the polarization of a signal.5 This, in turn, impacts the interaction between multipath components on the receiver side and the shape of the detected radiation patterns.
Figure 11 indicates the effect of multipath propagation and polarization alteration on the measured radiation patterns. Due to the multipath propagation, a change in orientation of the radiation patterns is visible.
Furthermore, Figure 11 shows a variation in the relative distribution of horizontally and vertically polarized signals between the different locations, indicating that the polarization of these signals have changed. The polarization alteration is especially visible at approximately 150° at location 4, where the vertically polarized signal decreases in power and the horizontally polarized signal increases correspondingly.
These figures are a prime example of why antenna diversity, i.e., integrating multiple antennas with different polarization in a device, can significantly enhance the received wireless signal strength of the device.
The reception of wireless signals propagating in an indoor environment depends strongly on the characteristics of the signal, distance between antennas, and layout of the environment. This was proven with a comparison between radiation patterns for different transmitter locations, which revealed how the RSSI and polarization can change by physically moving a wireless device within the same network.
In addition, the measurements showed that higher frequency signals suffer from more signal degradation as the distance increases between transmitter and receiver. These signals face a stronger interaction with the environment, making their wireless propagation more unpredictable and prone to distortion.
To draw clear and concise conclusions about the precise effects of objects on wireless signal propagation, a more comprehensive analysis and measurement approach is needed. Nevertheless, the research conducted in this article demonstrates that the discussed phenomena significantly affect the reception of transmitted wireless signals. It emphasizes the necessity of accounting for wireless signal propagation to ensure reliable wireless networks, not only during the design of new wireless products but also throughout the construction of environments housing wireless devices, as well as during the setup of wireless networks.
1. O. Appelman, “Ray Tracing Simulation Accuracy for Predicting Indoor Wireless Signal Reception,” pp. 1-12, 2023.
2. MegiQ BV.
4. D. M. Pozar, Microwave Engineering, 4th ed., 2012.
5. A. F. Molisch, Wireless Communications (2nd edition), 2011.
6. Aptab

Article written by: Oscar Appelman, founder of Aptab
Back